


How to Earn from AI Micro-Workflows at Home in 2025 Learn how to earn from AI micro-workflows at home in 2025 with simple automations that create scalable income, boost...

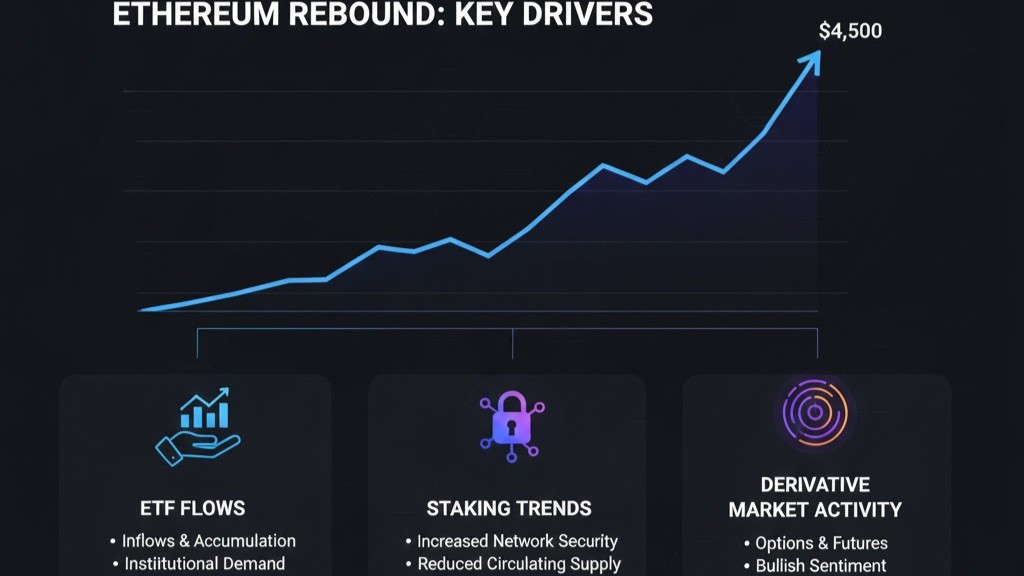
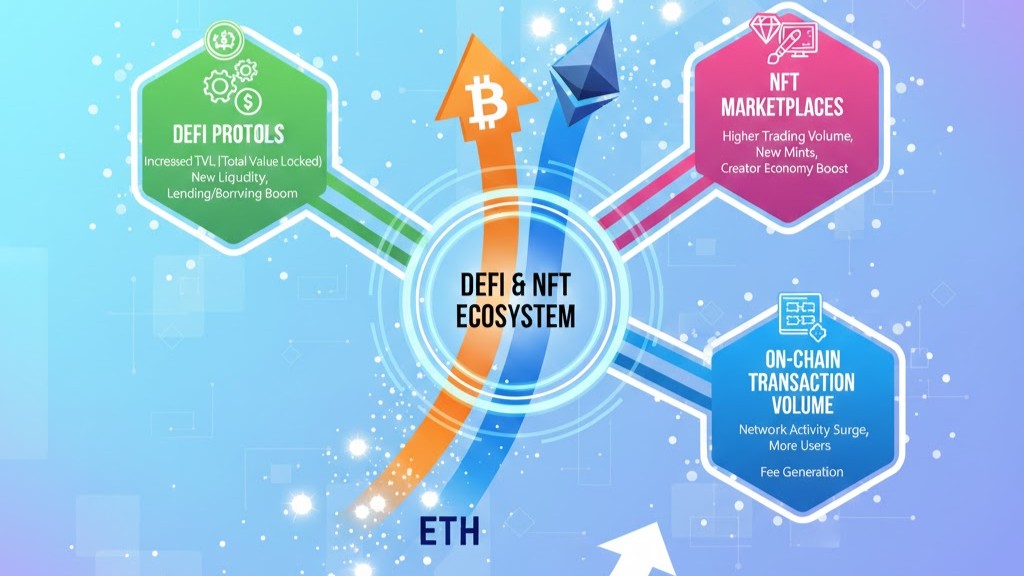
Strong Bitcoin and Ethereum Rebound Signals Market Shift 2026 Bitcoin and Ethereum rebound as market sentiment improves, driven by renewed investor confidence and...

What Makes Saga Unique in Web3 Gaming and App-Chain Economy Discover why Saga is transforming Web3 gaming with scalable app-chains, powerful developer tools, and a...

What Makes ZetaChain Unique in 2025’s Omnichain Ecosystem Discover why ZetaChain stands out in 2025 omnichain landscape, offering seamless cross-chain interoperability...

Merlin Chain (MERL): What Makes This Bitcoin L2 So Unique Merlin Chain (MERL) is a fast, secure Bitcoin Layer-2 enabling smart contracts, lower fees and scalable dApps on...

Taiko (TAIKO): Essential Guide to the ZK Ethereum L2 Learn Taiko (TAIKO), an EVM-equivalent ZK Ethereum L2: how it works, fees, wallets, bridges, security, and dApp...

Top 8 Ways to Profit from Telegram Mini-Apps in 2025 Discover eight strategies to profit from Telegram Mini-Apps in 2025 — no-code bots, payments growth tactics, and...

BlackRock Tokenized Fund Now Collateral on Binance Late 2025 Binance now accepts a BlackRock tokenized fund as collateral, marking a leap for RWA adoption, deeper...
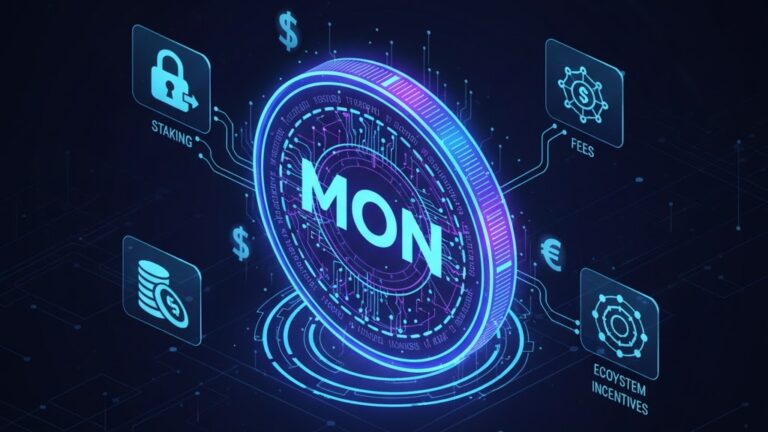
Monad (MON): The Next Big Layer-1 Revolution of 2025 Monad (MON) is a next-generation Layer-1 blockchain aiming to redefine EVM speed, scalability, and efficiency with...